SOFTWARE FOR ELECTRON MICROSCOPES
Maps 3 Software
Correlative electron microscopy and cross-platform imaging automation software.
Thermo Scientific Maps Software is an imaging and correlative workflow software suite compatible with the full line of Thermo Scientific SEM, DualBeam (FIB SEM) and TEM platforms.
Scientists and researchers rely increasingly on nanoscale observations to inform the latest advances in research and analysis. It has, however, become apparent that high-resolution observations lose much of their utility in the absence of the larger macroscopic context. Observations from multiple sources must be linked, providing the necessary multi-scale and multi-modal insight for truly valuable data.
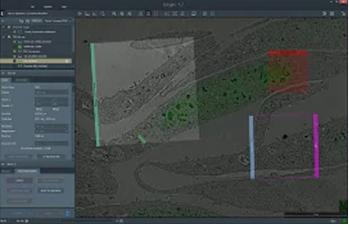
Maps Software provides a powerful imaging workflow automation package within an easy-to-use and robust platform. With just a few clicks, you can collect impactful data while preserving the context of your observations.
Key Features
- Compatibility with current Thermo Scientific SEM, FIB-SEM, and TEM platforms; providing a unified user experience across all instrument types.
- Integrated approach to data acquisition, annotation and storage.
- Automated acquisition of large overviews at any magnification (tile and stitch); multiple acquisitions can be set up for unsupervised batch data collection.
- Setup and coordination of experiments across multiple microscopes.
- Correlation of images from different microscopes, including imported images from 3rd party instruments using the integrated Bio-Formats Library.
We have incorporated mapping capability for our Apreo SEM
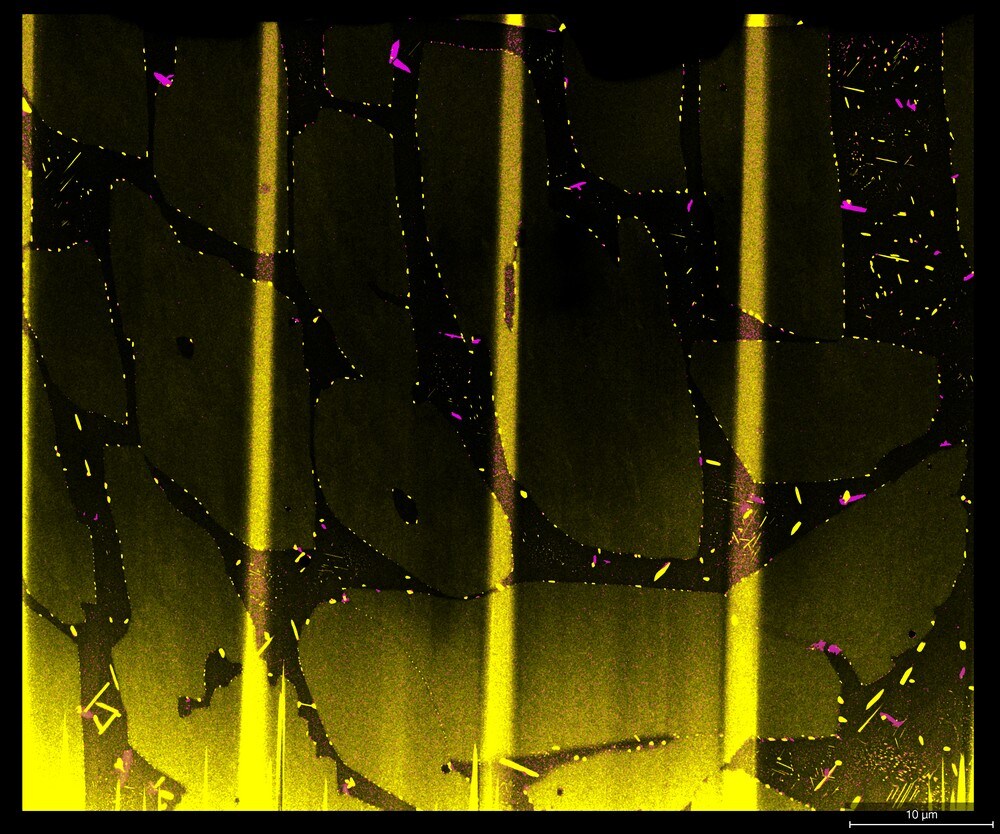
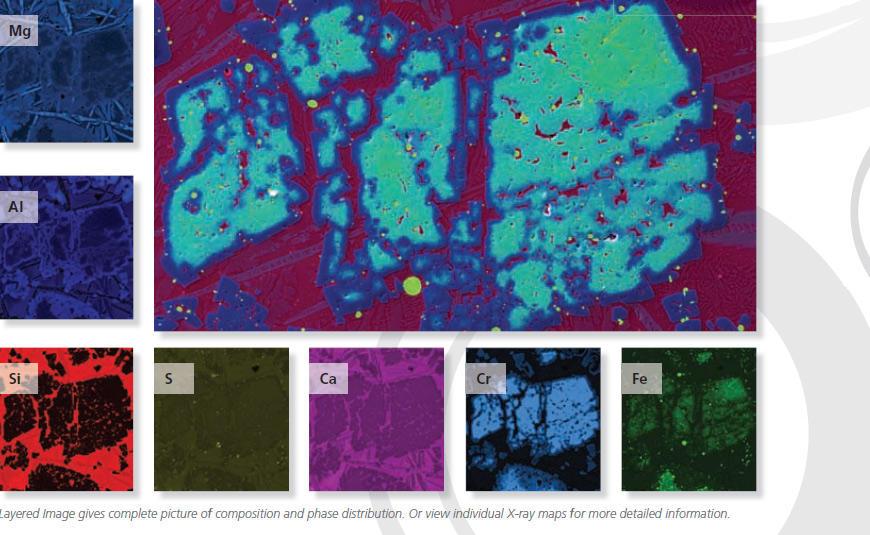
Combining and overlaying EDS Element maps on an electron image to make one informative colored image is fast becoming a common way to view the distribution of elements in a specimen. But it’s important to know that the data behind this good-looking image is correct.
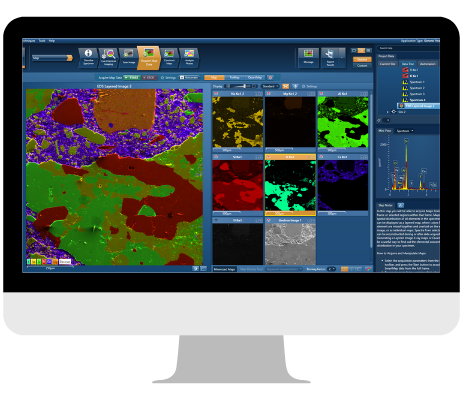
SmartMap
SmartMap spectral mapping brings the benefits of automatic qualitative analysis into two dimensions to identify elements and show their distributions. Now see how all elements are distributed in a specimen
- No specimen pre-knowledge required
- Maps for all elements identified and generated automatically
- Single Layered Image highlights chemistry and phase distribution in seconds
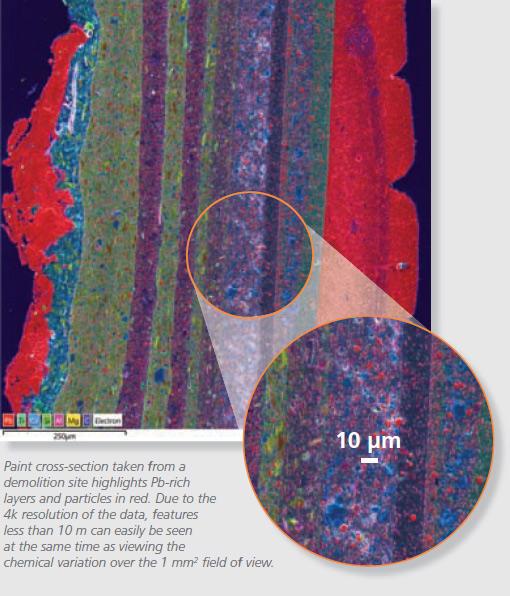
- Up to 4K SmartMap resolution to combine wide area and high-resolution studies
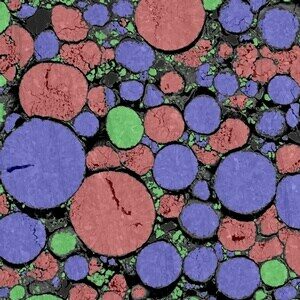
AutoLayer – a complex story made simple
At the click of a button, AutoLayer takes the often complex information contained in a set of X-ray maps and turns it into a single image that helps you visualize both phase and element distribution in your specimen.
- Instantly and automatically interprets your specimen
- Highlights what’s important in a single image
- Unravels the complexity of real specimens
- Colors on the Layered Image correlate to the X-ray map colors
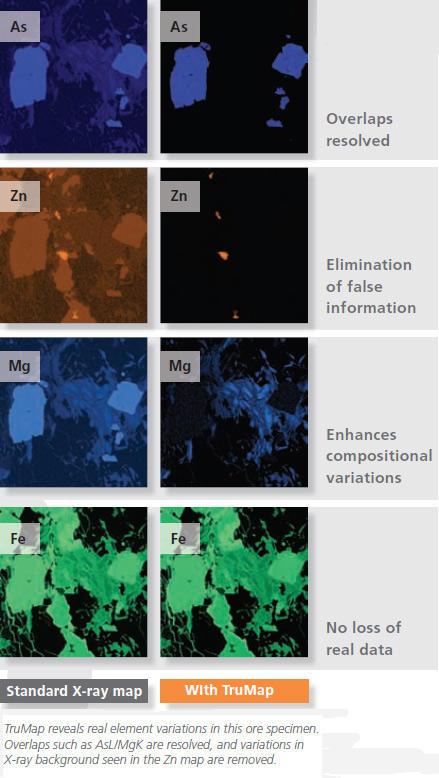
TruMap
TruMap is a unique real-time mapping solution that takes advantage of the increased counts generated by the latest SDD detectors, offering a new level of data integrity……now you can see the real element variation.
- Eliminates artefacts
- Corrects element overlaps
- Removes false variations due to X-ray background
- Everything operates in real-time
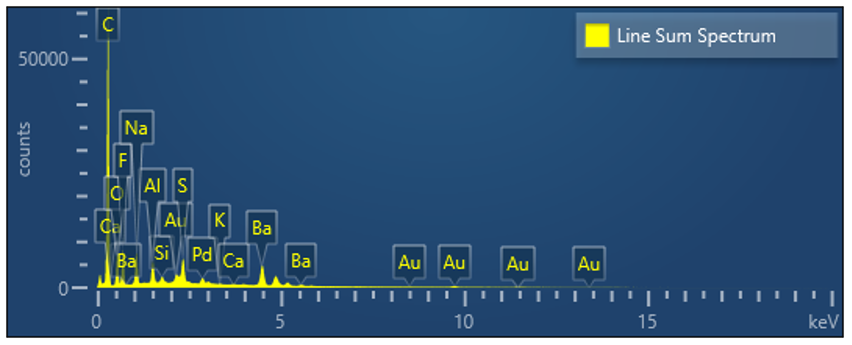
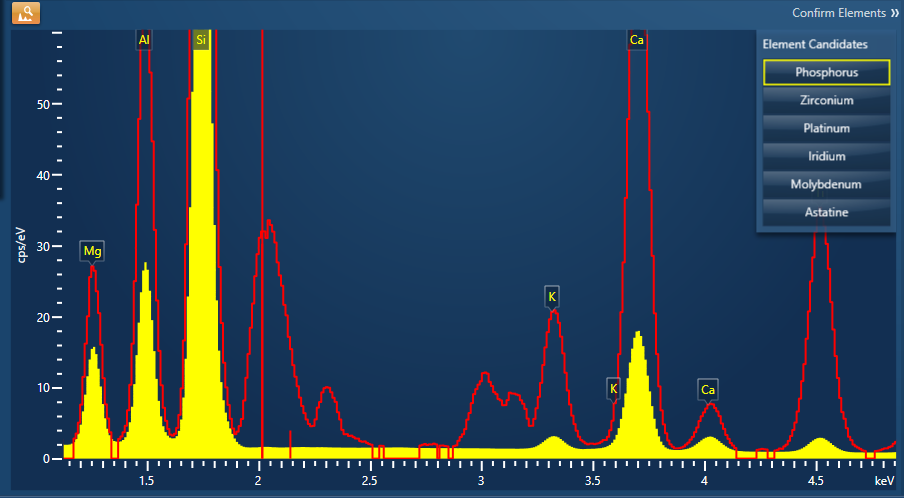
Spectrum Examiner
Spectrum Examiner enables small phases to be detected that would otherwise be overlooked
- Automatically analyses a SmartMap
- Highlights interesting energy regions in the sum spectrum where there is a significant variation in pixel counts.
Need help with SmartMapping and Line Scanning your SEM?
Complete the form on this page or contact us.